
2025 Southern California Utility Rate Comparison
2025 Southern California Utility Rate Comparison:
LADWP vs. Ventura County and Regional Utilities
Thinking about your water and electricity bills? Here’s a detailed comparison of 2025 rates, including examples for both "average" homes and high-usage/larger homes. This covers LADWP (Los Angeles), Ventura County, and other major Southern California utilities.
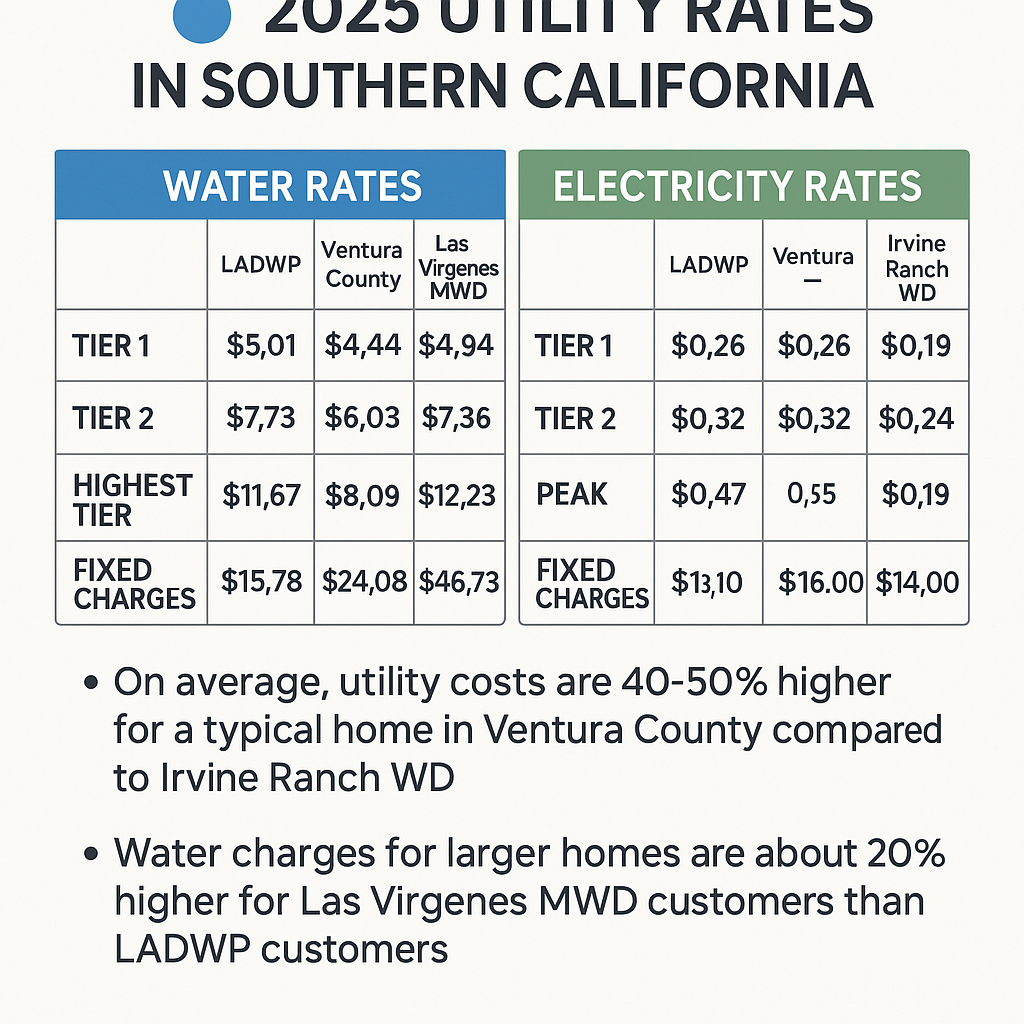
Water Rate Comparison (2025)
| Utility/Area | Tier 1 | Tier 2 | Highest Tier | Typical Fixed Charge (mo.) |
|---|---|---|---|---|
| LADWP (Los Angeles) | $11.61 | $13.62 | $12.79–$13.85 (T3/T4) | $10 |
| Ventura City | $4.60–$5.00 | $6.00 | $6.80+ | $35.59 |
| Las Virgenes MWD | $4.76 | $5.69 | $7.92 | $29.24 |
| Irvine Ranch WD | $2.07 | $2.72 | $7.51–$18.60 | $13.00 |
Note: Some water providers have additional surcharges or pass-through charges that may increase your actual costs.
Example Monthly Water Bills: "Average" vs. "Larger" Homes
| Average Home (6 HCF/mo) |
Larger Home (30 HCF/mo) |
|
|---|---|---|
| LADWP (L.A.) | $84 | $378 |
| Ventura City | $64 | $175 |
| Las Virgenes | $61 | $151 |
| Irvine Ranch WD | $38 | $160 |
Water bills include typical fixed/service charges and tiered rates.
Larger home example assumes 20 HCF at Tier 1, 10 HCF at Tier 2 (if applicable).
Larger home example assumes 20 HCF at Tier 1, 10 HCF at Tier 2 (if applicable).
Electricity Rate Comparison (2025)
| Provider/Area | Tier 1 (¢/kWh) |
Tier 2 (¢/kWh) |
High/Peak (¢/kWh) |
Monthly Fixed |
|---|---|---|---|---|
| LADWP | 23.0 | 28.9 | ~37 (T3/Summer) | $12 |
| SCE (Ventura County) | 30 | 32 | 41 (TOU Peak) | $15 |
| SDG&E (San Diego) | 35 | 45 | 45+ | $16 |
| Clean Power Alliance | 30.2 | 32.9 | 40.8 (peak) | $15 |
Note: Time-of-use (TOU) rates can vary widely. Tables reflect standard tiered plans; TOU users may see lower off-peak/lower shoulder rates and higher peak rates.
Example Monthly Electric Bills: "Average" vs. "Larger" Homes
| Average Home (600 kWh/mo) |
Larger Home (1,360 kWh/mo) |
|
|---|---|---|
| LADWP | $162 | $425* |
| SCE (Ventura) | $186 | $450* |
| SDG&E | $270 | $595* |
*Larger home estimates assume typical tiered breakdown, fixed fee, and about 1,360 kWh/month usage; actual bills may be higher if time-of-use peak pricing or surcharges apply.
Average home: LADWP uses 400–600 kWh/month for its "average" bill estimates.
Average home: LADWP uses 400–600 kWh/month for its "average" bill estimates.
Key Takeaways
- LADWP water rates are among the highest in Southern California, nearly 2–3× higher than Ventura County or Irvine Ranch for base usage, and much higher at high use.
- LADWP electric rates begin a bit lower than SCE or SDG&E but escalate sharply as usage rises. Heavy-use households face monthly bills 2–3× higher than published "average" bills.
- Ventura County (SCE) has lower water costs than LA but similar or higher electricity costs, especially for larger homes or in hot inland areas.
- SDG&E (San Diego region) now reports the highest electricity rates (and bills) in California; water is more expensive than in Ventura but cheaper than LA.
- Fixed "average bills" reported by utilities are based on much lower consumption than large homes—real-world bills for bigger homes can be double or triple the average.
Summary: What to Expect in 2025
Southern California utility costs continue rising due to imported water dependence, infrastructure, and climate stresses. Los Angeles specifically stands out for exceptionally high water rates. Electricity is expensive everywhere—in some areas highest in the nation. High consumption (large homes, pools, big yards, EV charging) dramatically increases your household’s utility bills beyond the "average" costs displayed in most comparisons.
Want to save? Rebates, time-of-use plans, drought-tolerant landscaping, and home efficiency improvements can help, but large home/high-usage buyers should plan for utility bills that may rival or exceed your mortgage payment.
Disclaimer: All information presented is deemed reliable but not guaranteed. Rates, structures, averages, and calculations are based on the most current publicly available data as of mid-2025, but may change without notice. Always verify with your local utility provider for your specific address and the latest rate sheets.
Categories
Recent Posts
More Homes, Better Prices: A Buyer’s Summer
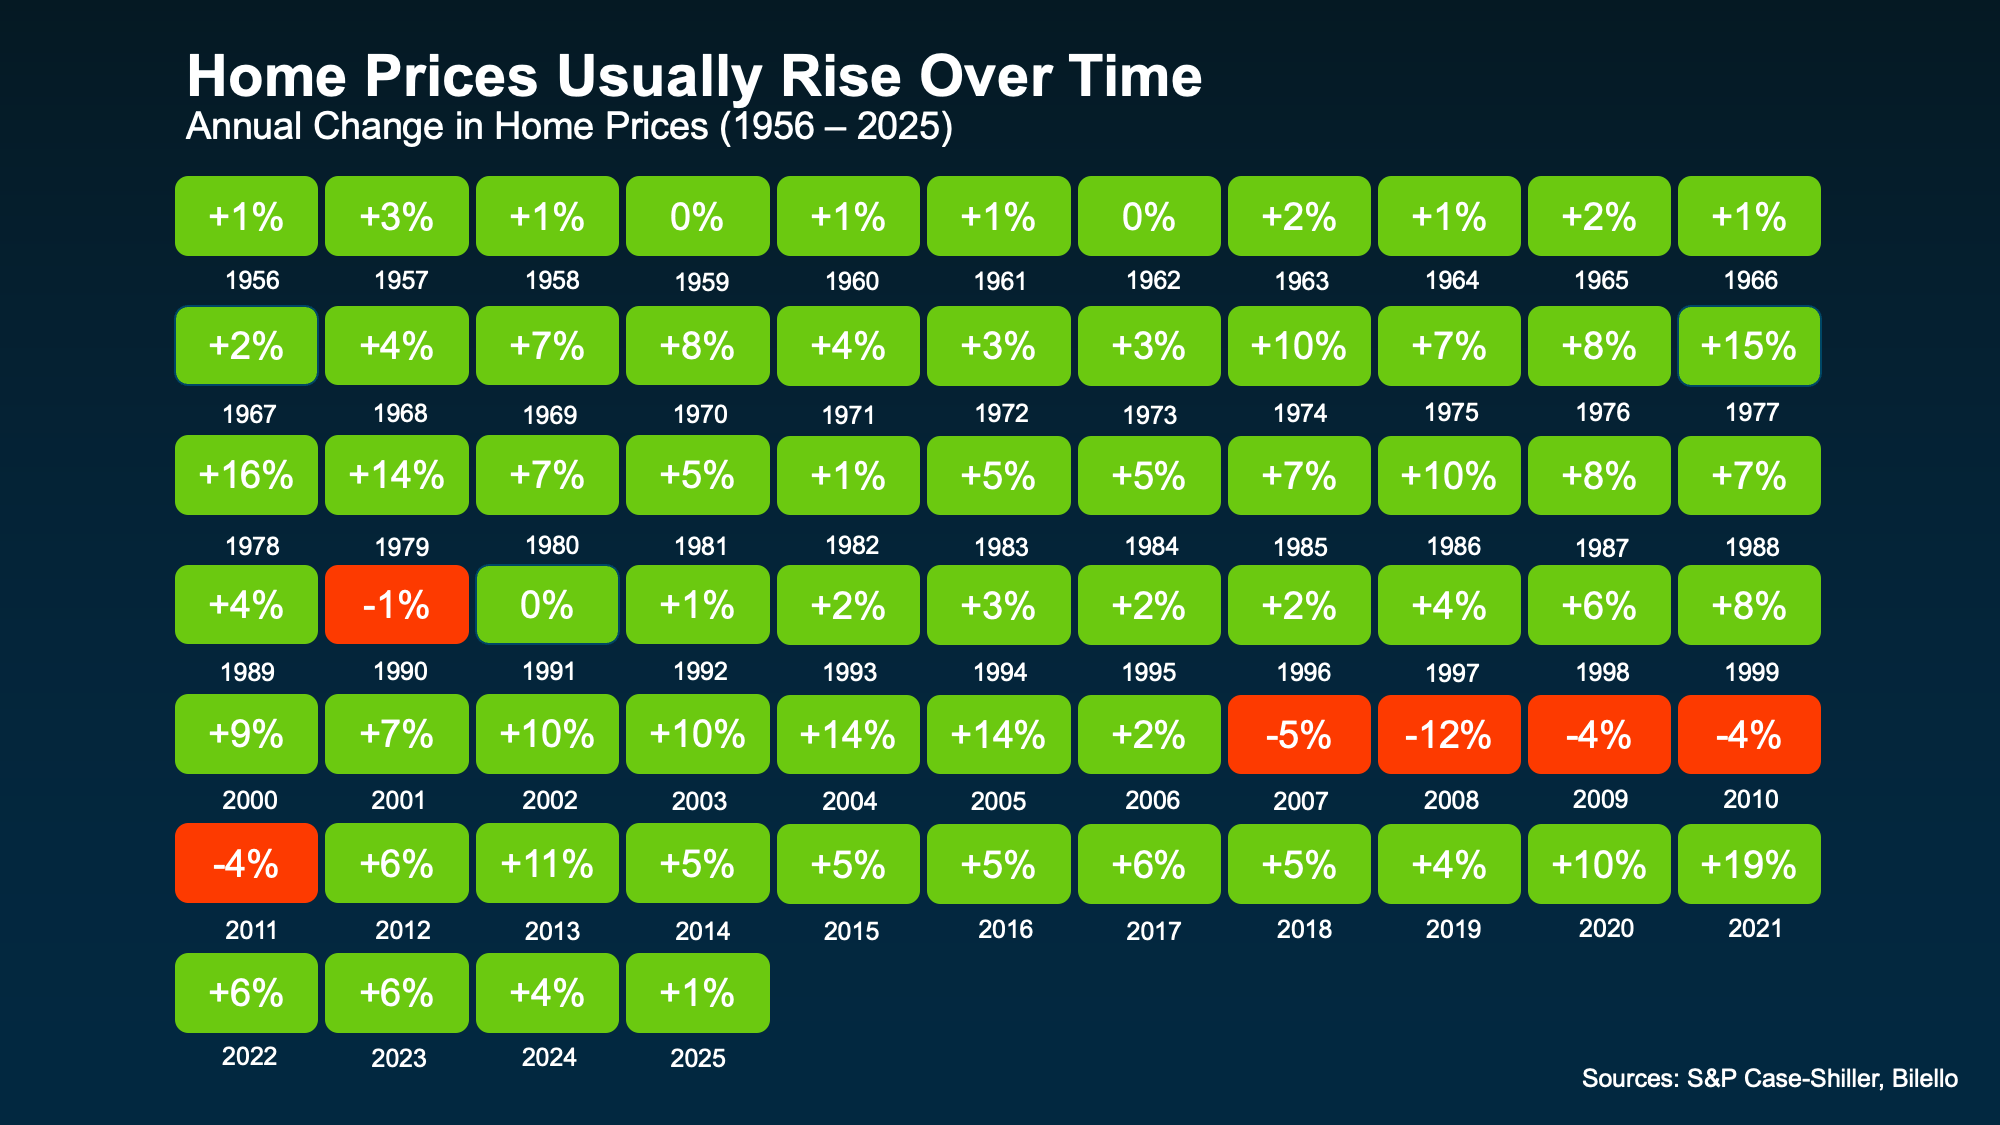
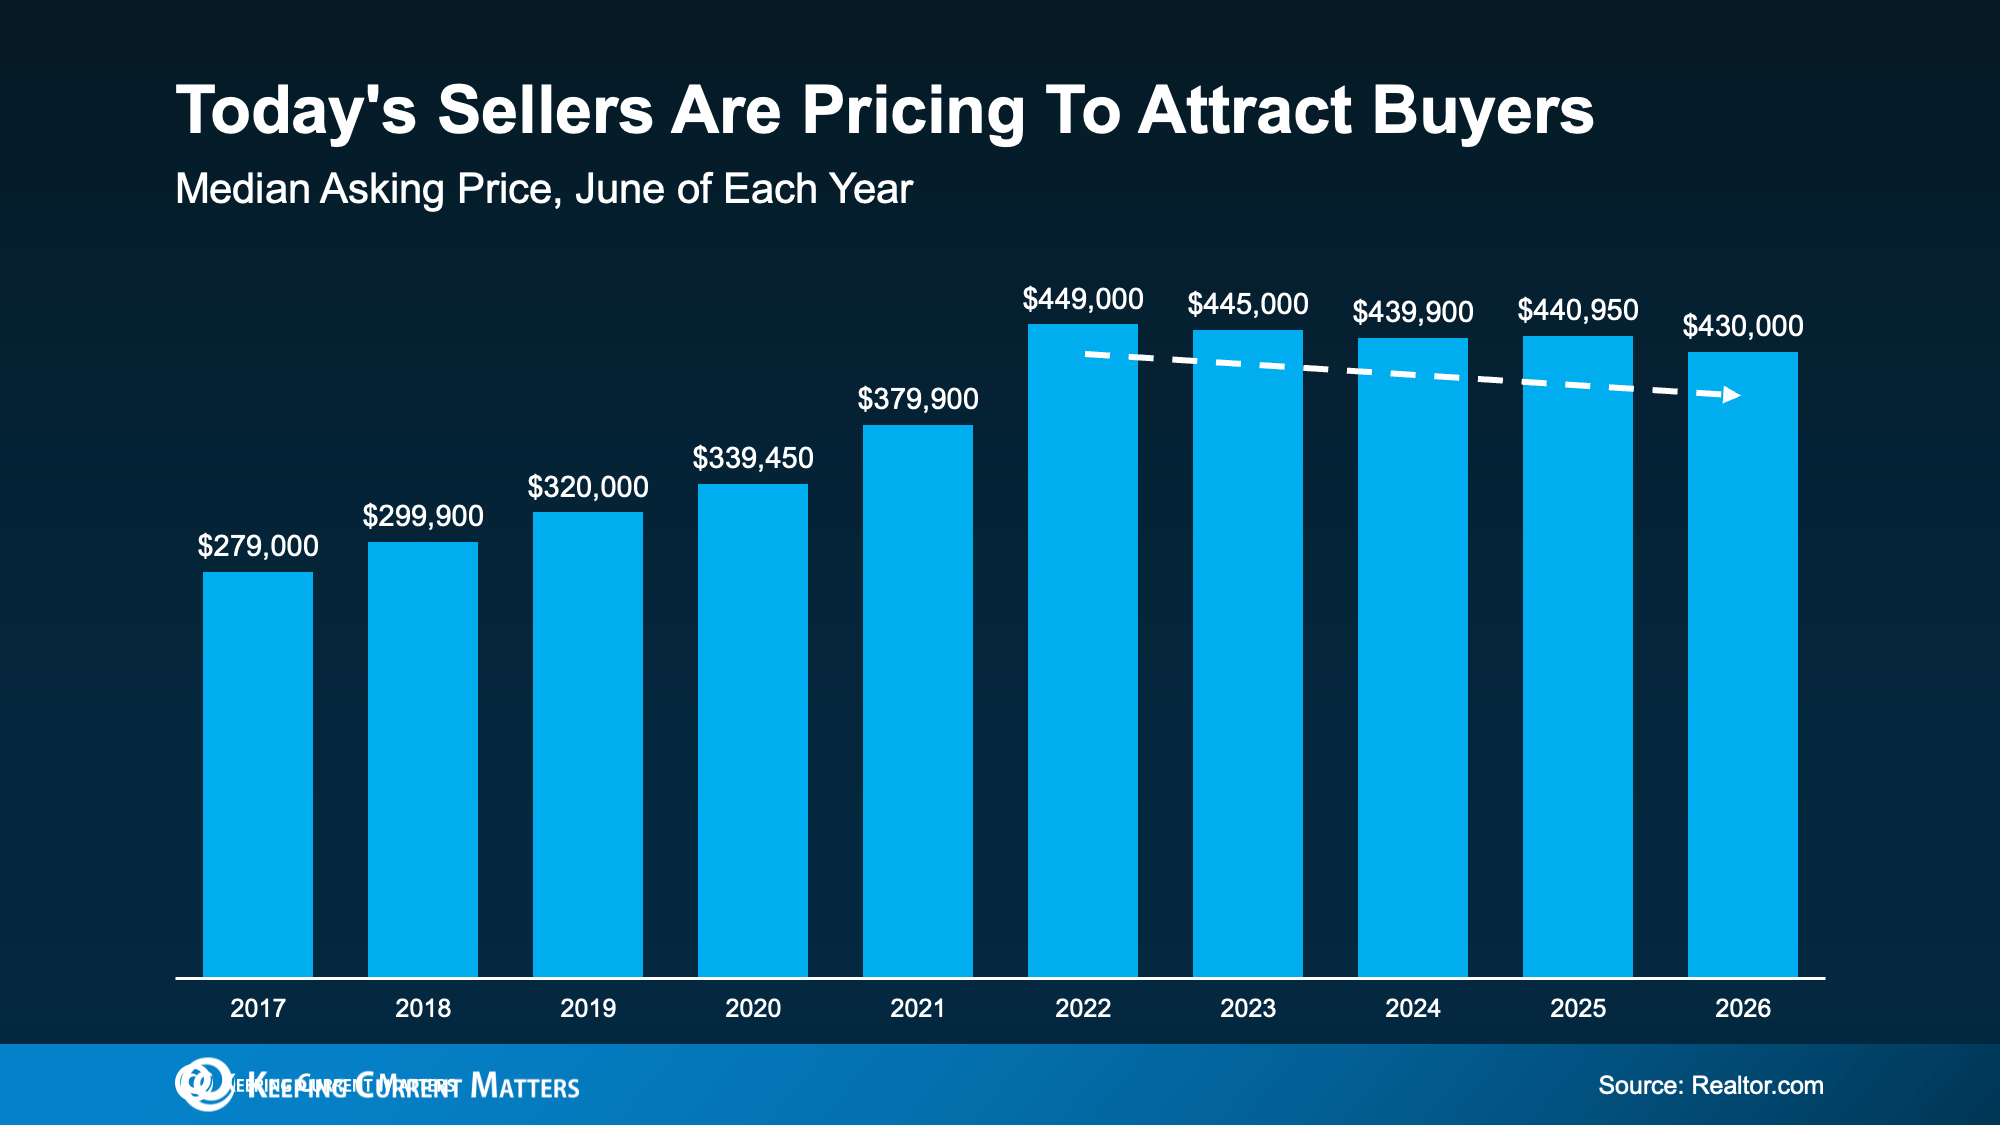
Are Home Prices Going To Fall?
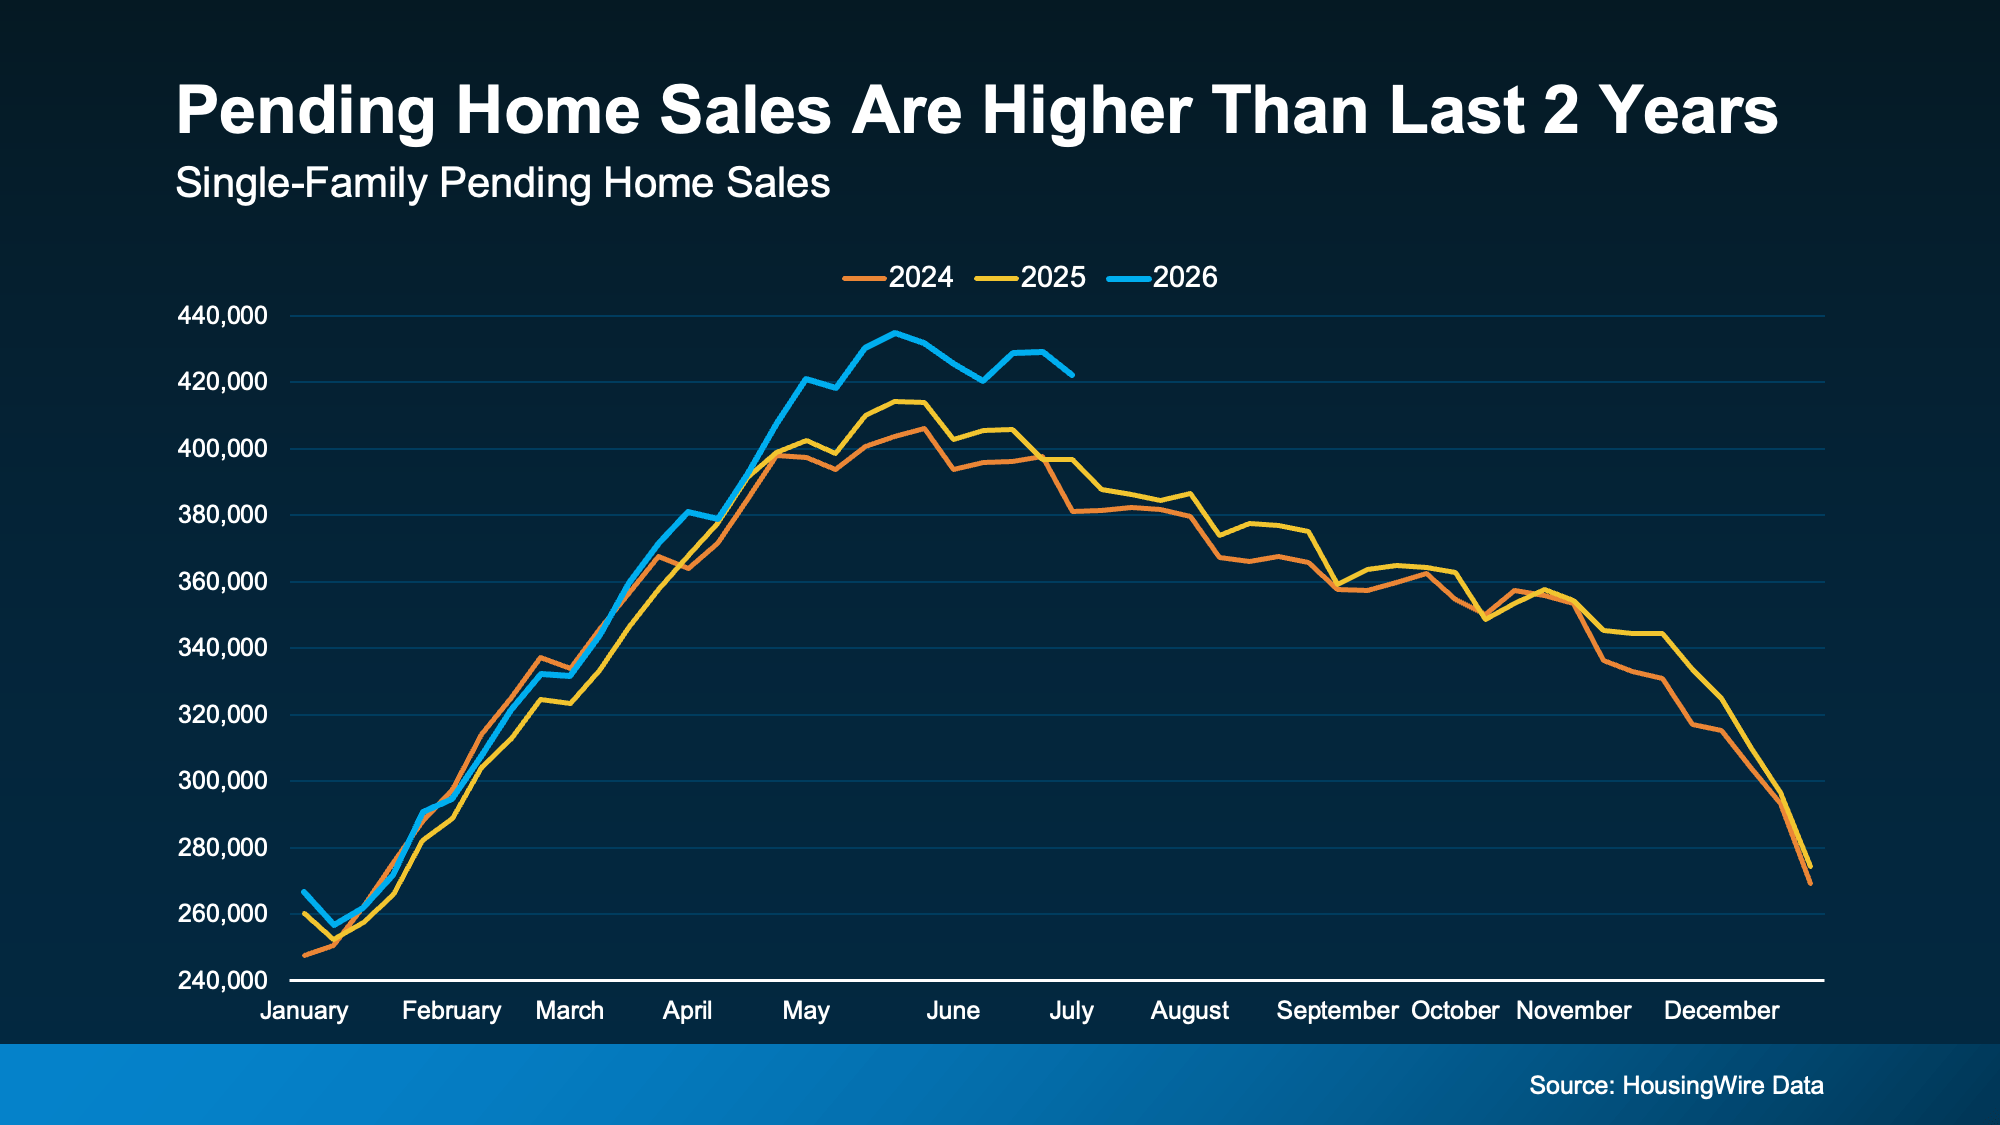
Think Nobody's Buying Homes Right Now? Think Again.

First-Time Buyer Programs in California: What's Available in 2026

Renting vs. Buying in LA in 2026: The Real Math

Prop 19 for Downsizers: Taking Your Property Tax Base With You

The LA "Mansion Tax" (Measure ULA) in 2026: What Sellers Need to Know

Demystifying Closing Costs in Los Angeles: What Buyers & Sellers Actually Pay

Pool Homes in the Valley: What They Really Add to Value

Single-Story Homes in the Valley: Where to Find Them
GET MORE INFORMATION